Candlestick Charts Explained
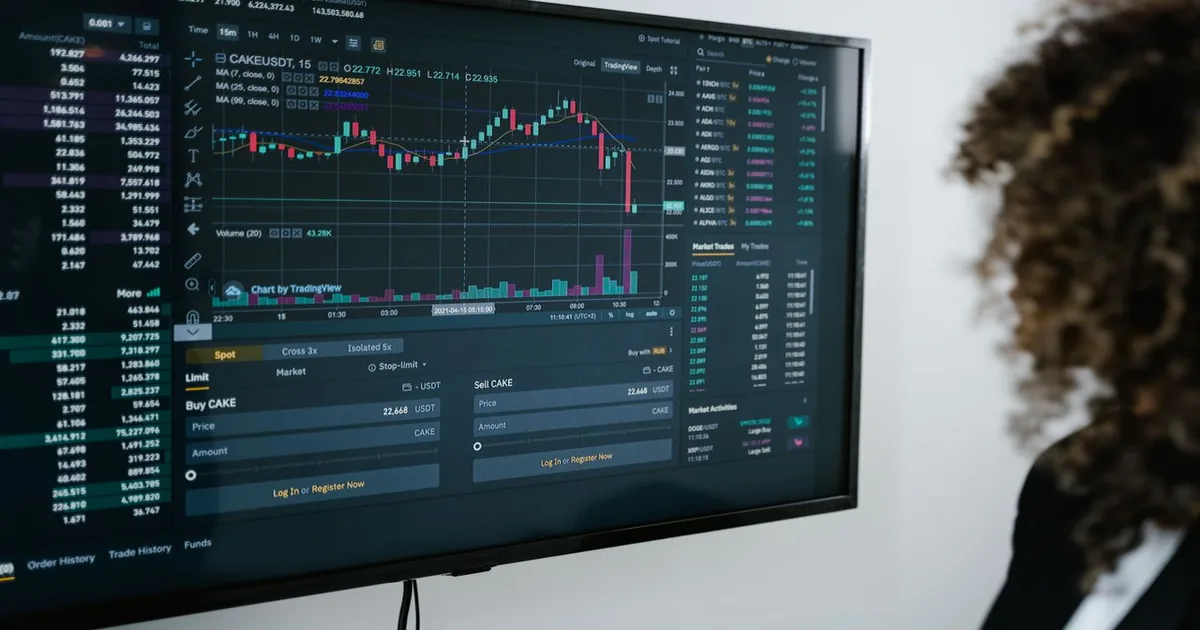
The most common stock chart type is the candlestick chart, developed in Japan in the 18th century. Each "candle" represents one time period — a day, week, or month depending on your chart setting. Each candle has four data points: the Open (price at start of period), High (highest price during period), Low (lowest price during period), and Close (price at end of period).
The rectangular body of the candle spans from open to close. If the close was higher than the open (price rose), the body is typically green or white. If the close was lower (price fell), it's red or black. The thin lines extending above and below the body are called "wicks" or "shadows" — they show the high and low extremes reached during the period.
Understanding Volume
Volume bars appear at the bottom of most charts, showing how many shares traded during each period. Volume provides context for price moves: a large price increase on high volume signals strong conviction behind the move. The same price increase on very low volume may be less meaningful — fewer participants agreed on that price.
Volume spikes often coincide with news events — earnings reports, product announcements, or broader market movements. Unusually high volume on a quiet news day can signal institutional activity (large fund buying or selling).
Moving Averages
A moving average smooths price volatility by averaging the closing price over a set number of periods. The 50-day moving average (50-day MA) averages the past 50 daily closes; the 200-day MA averages the past 200. They're displayed as smooth lines overlaid on the price chart.
Using moving averages: When price is above the 200-day MA, the long-term trend is generally considered upward (bullish). When below, it's downward (bearish). The 50-day MA shows medium-term trend. When the 50-day crosses above the 200-day, it's called a "golden cross" — often cited as a bullish signal. The reverse (50-day crossing below 200-day) is a "death cross" — bearish signal. These signals are lagging — they confirm a trend change after it's begun, not before.
Support and Resistance
Support is a price level where a stock has repeatedly bounced upward — meaning buyers have historically stepped in at that price. Resistance is the opposite — a price level the stock has struggled to rise above. These levels are visible on charts as horizontal areas where price has repeatedly reversed. When a stock breaks through resistance with strong volume, that former resistance often becomes new support.
Choosing a Timeframe
Long-term investors (years): monthly or weekly charts show the big picture without noise. Medium-term (months): daily charts. Short-term traders: hourly or intraday charts. The same stock can look very different depending on timeframe — always check multiple timeframes for context. A stock can be in a long-term uptrend while in a short-term pullback, which looks very different on a 1-day vs 5-year chart.
Reading Charts Globally
UK: UK investors use the same chart types for LSE and AIM stocks. Most UK brokers (Hargreaves Lansdown, AJ Bell, Interactive Investor) include built-in charting. London Stock Exchange prices are quoted in pence, not pounds — a share priced at "1,500p" costs £15.
India: NSE and BSE charts use the same candlestick format. Indian platforms (Zerodha Kite, Groww, Upstox) have sophisticated built-in charting tools. India's market opens 9:15 AM and closes 3:30 PM IST. F&O (futures and options) activity heavily influences intraday price movement in large-cap stocks.
Canada: TSX charts use the same format. Canadian investors access charts through platforms like Questrade, Wealthsimple Trade, or TD Direct Investing. Note that many Canadian stocks are interlisted on both TSX and NYSE/NASDAQ — the same shares trading on two exchanges simultaneously, with prices converting at the exchange rate.